You’ve likely heard the term property cycle mentioned—Boom, Slowdown, Slump, Recovery—but how much can we rely on it to forecast where the Hamilton property market is headed? Let’s take a look.
Understanding the property cycle
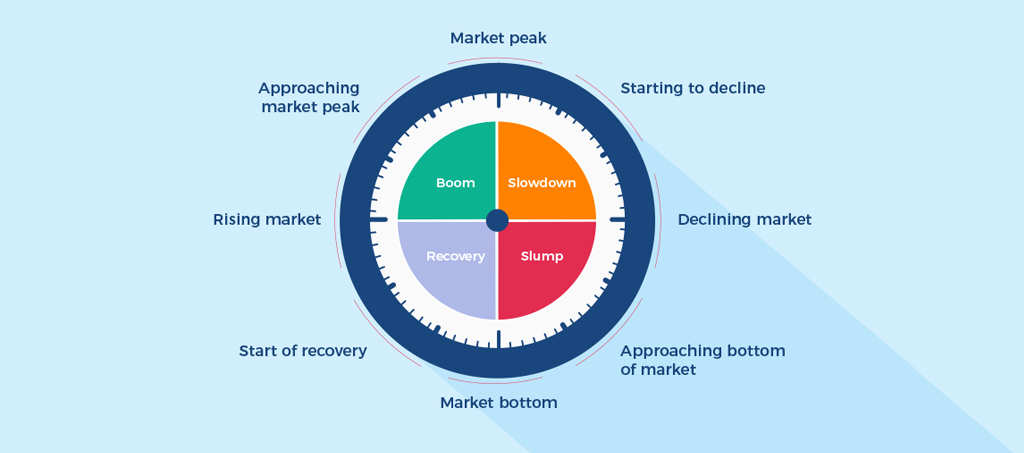
The property cycle is often represented as a property clock. Twelve is the market peak; three the decline; six the market bottom and nine the rising market and subsequent boom.
What is important to know is that while the property cycle is represented as a clock, it does not operate like clockwork. Slowdowns, slumps, recoveries and booms can vary in duration from anything as long as years to a matter of weeks.
How do home buyers and sellers use it?
Knowing what stage the property clock is at can help buyers and sellers, particularly investors, get a picture of where the market is, where it is headed, and to plan their next steps. Sellers will ideally want to sell their property at the top of the clock, where the market is at a high point. Buyers, on the other hand are waiting for the market to bottom out. Here property prices are at their lowest and there is an opportunity for more capital gains to be had as the market eventually recovers and rises again.
However, buying at the “six” does have its drawbacks. Interest rates are likely higher, bank lending often tighter, and there’s always a risk that the market hasn’t actually reached rock bottom yet. Due to this risk, investors may wait to buy at the 7 or 8 once they’re sure the market is well into a definite stage of recovery.
How to judge the property clock
Judging where the hands of the property clock sit requires a close watch on a number of influencing factors. Economics, migration, local developments, buyer behaviour: the list is extensive, but a few common signs are:
In a slowdown and slumping market (12 to 6):
- Falling real estate values.
- Falling share prices.
- Falling commodity prices.
- Tighter bank lending.
- Failing yields.
- Oversupply of property.
- Rising interest rates.
- Lower sales volume/prices.
- Falling construction.
In a recovering and rising market (6 to 12):
- Rising real estate values.
- Rising commodity prices.
- Falling interest rates.
- More relaxed bank lending.
- Rising yields.
- Undersupply.
- Falling interest rates.
- Rising sales volumes/prices.
- Rising construction.
- Rapidly rising prices.
- High auction clearance rates.
Where the property clock comes unstuck
What people must realise is that the property clock is a simple concept applied to a complex, unpredictable market. A number of factors are in play from region to region, even suburb to suburb. Distortionary effects, take high immigration and migration, for example, can change the behaviour of the market.
The result, as already touched on, is that the clock’s timing is inconsistent and doesn’t always match up with how the market is behaving. Take our most recent property “boom” for instance: it lasted six years.
“There are several periods in our history where prices have gone flat for an extended period of time,” says Jeremy O’Rourke, Managing Director of Lodge Real Estate.
The 1970’s housing crash is a good example of this. After a rapid two-year rise and peak, the market crashed in 1974 and house prices fell by 40 per cent over six years. The long, slow recovery afterwards lasted until the mid-1990s before the market finally reached pre-crash prices.
Can you rely on it?
The short answer: no. The property clock is a tool to track the property cycle, but it’s limited in its ability to accurately forecast. Changes in the economy (both on a macro and micro level), unforeseen events (think 2011 Christchurch earthquakes), and changes in policy (loan-to-value ratios for example) can change the dynamics of a housing market and cause the cycle to deviate from its norm.
“The property clock can’t indicate when the next sharp rise in Hamilton house prices will occur,” says Jeremy. “All it tells us is simply that it’s likely to occur given historical patterns.”
Examining current and past market trends and data—and then the factors that influence it—can provide more actionable insights, particularly for local markets. For example, from time to time the Hamilton median sale price deviates away from the New Zealand median sale price. What follows soon after is a rapid price increase that sees the Hamilton median come back up to meet the national one.
Want to learn how to conduct your own property research? Click here.
“There are periods in Hamilton's history where that separation has become quite pronounced,” says Jeremy. “If you believe in cycles and that history repeats itself, then when this phenomenon occurs is an obvious time to enter the market.”
If you want to use the property clock to buy and sell, research property trends for your area, read market reports and talk to your local agents. Don’t rely on others to tell you where the hands are; use your own judgement.
Want to make smart, informed moves on the Hamilton property market?
Learn how to better research your local Hamilton real estate market with our free guide!